Explorer
Anything connected to Connectware will be transformed into MQTT messages. Those messages carry all the data Connectware is dealing with. The message are organized into topics, allowing to structure and interconnect the data for arbitrary consumers and publishers.
The Data Explorer allows you to graphically interact with these topics and view the data of the respective messages.
Important
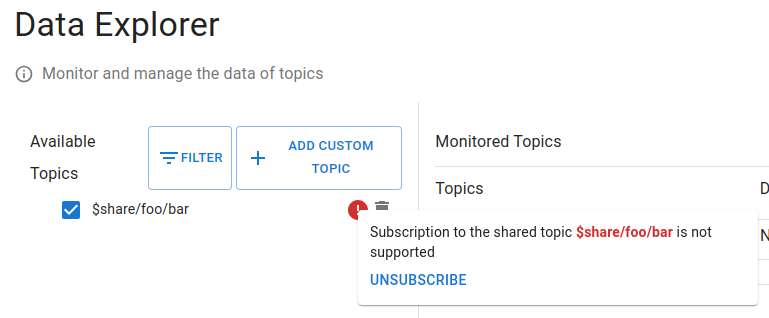
MQTT shared subscriptions are disabled on the Data Explorer for the smooth operation of other clients possibly subscribed to the same topics.
How to Use It
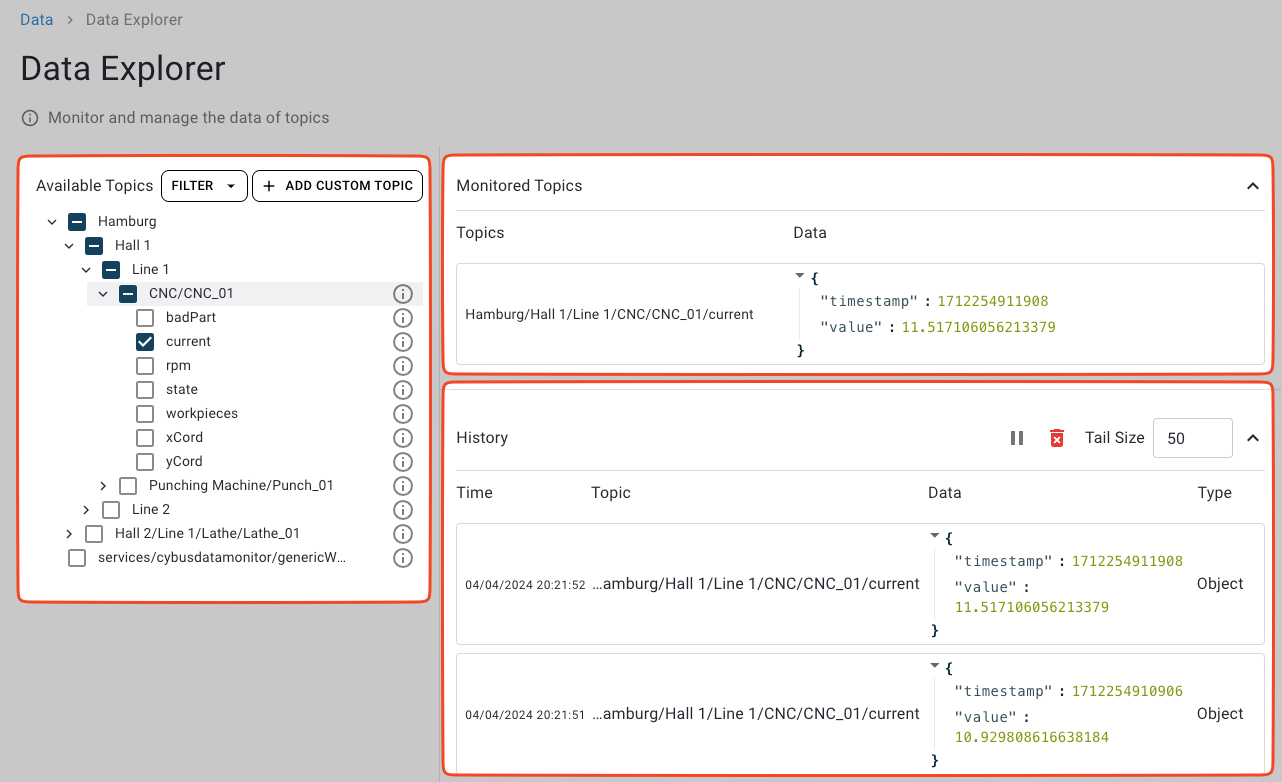
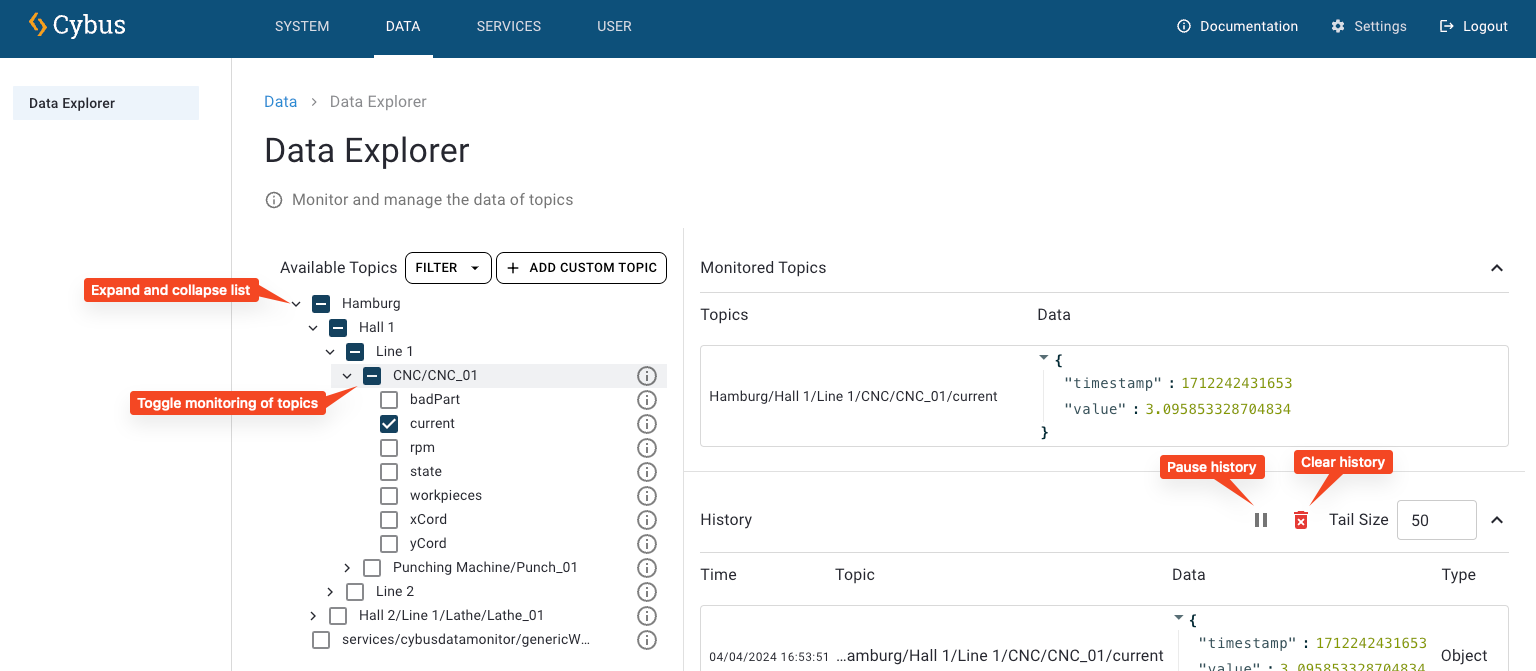
After you have connected a device to Connectware, navigate to the Explorer section of the admin-ui. You will be presented with a view with three sections like the picture below.
Data Topics
The Data Topics section of the Explorer allows you to view all current topics available in your Connectware in a hierarchical structure. The base topics are at the highest level and the down arrows allow you to descend into the topic structure until you reach the desired endpoint. The topics are ordered alphabetically.
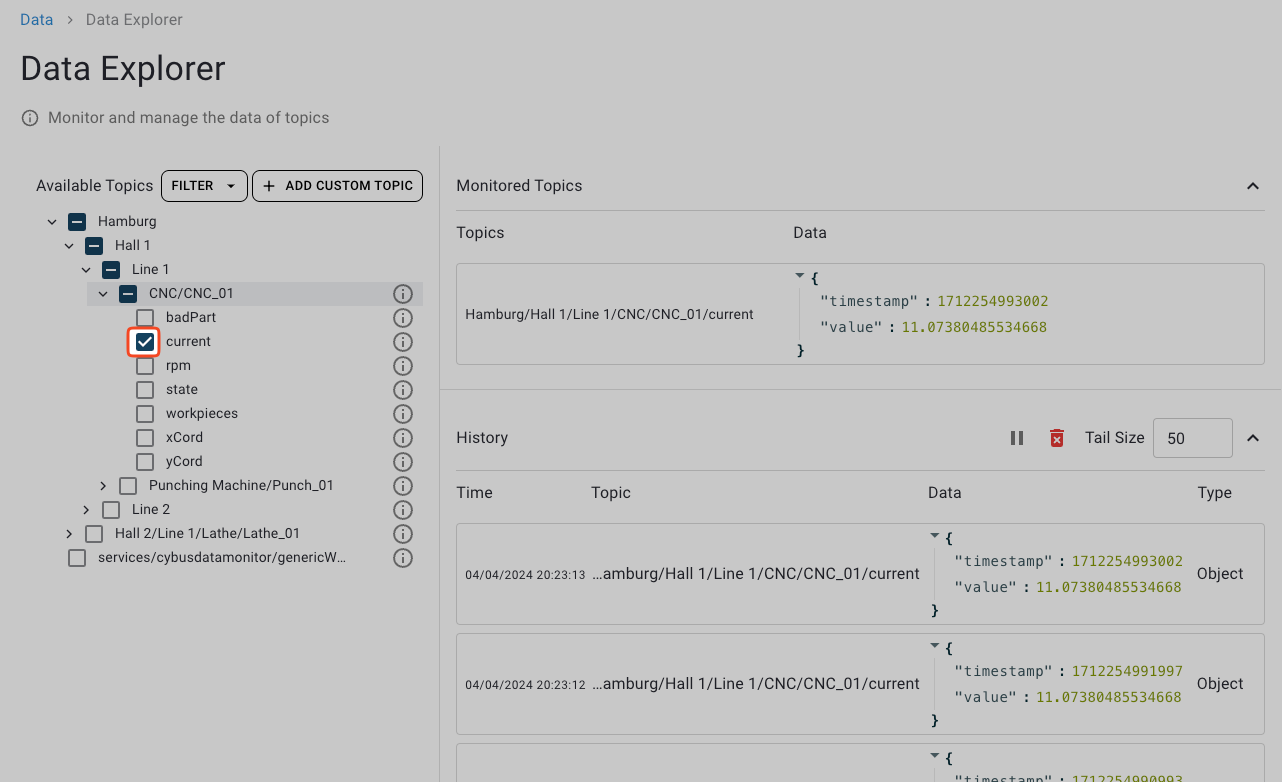
Once the desired endpoint is found, you can move your mouse pointer over the topic, click the eye icon on the right side of the topic, and the topic will be added to the list of monitored items in the Monitor section on the right. If you wish to remove a monitored item simply click the eye icon on the selected item again.
Monitor
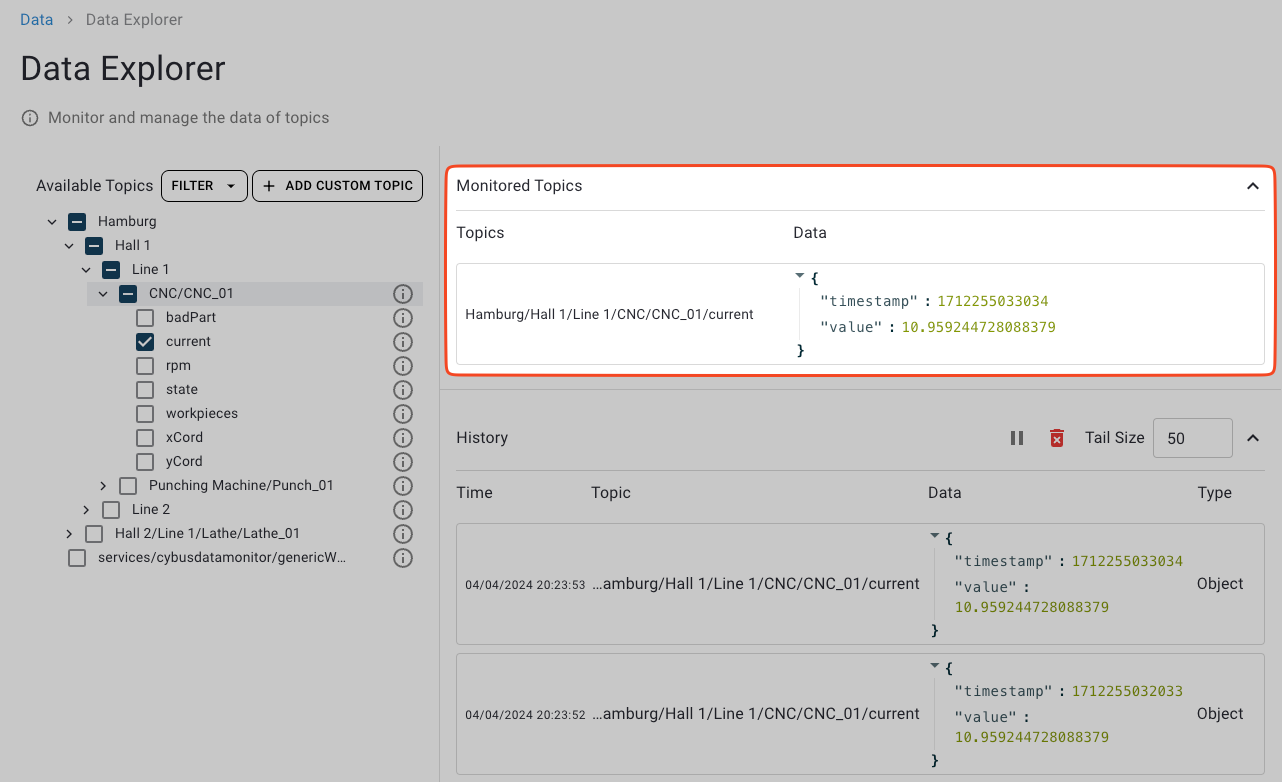
The Monitor section of the Explorer allows you to view all topics and their respective data, according to the topic selection from the Data Topics section on the left. If you wish to remove an item from the Monitor simple click the trash icon on the right side of the respective topic.
Once new data is available on a monitored topic, the data of that topic will be updated here in the Monitor section.
Copying Data to Clipboard
The data values which are displayed in the Monitor section or the History of the explorer are shown in changing formats according to their data types.
History
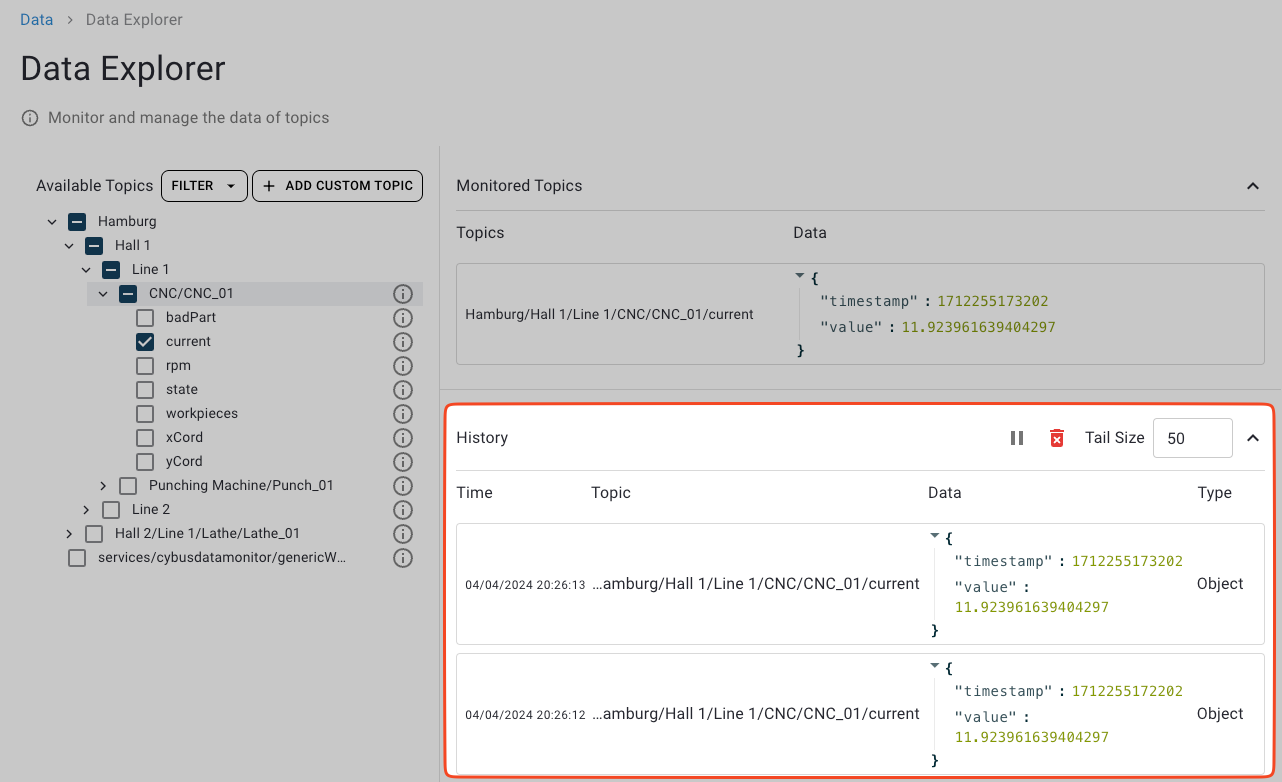
The History section of the Explorer allows you to view logs of all updates from the currently monitored topics. Every time an update to a monitored topic is available, a new log line will be appended to the History.
If you wish to look at some log lines in detail without receiving further updates, you can pause updates of all topics by clicking the pause icon in the upper right corner of the History section. If you wish to receive updates again, simply click the icon again.
If you want to clear out all the recorded logs, click the trash icon in the upper right corner of the History section.
