System Status
When clients publish to the MQTT broker and log information, Connectware collects and temporarily stores that information. On the System Status view, you can monitor usage data information and the current state, configuration, and logs of Connectware containers.
Info
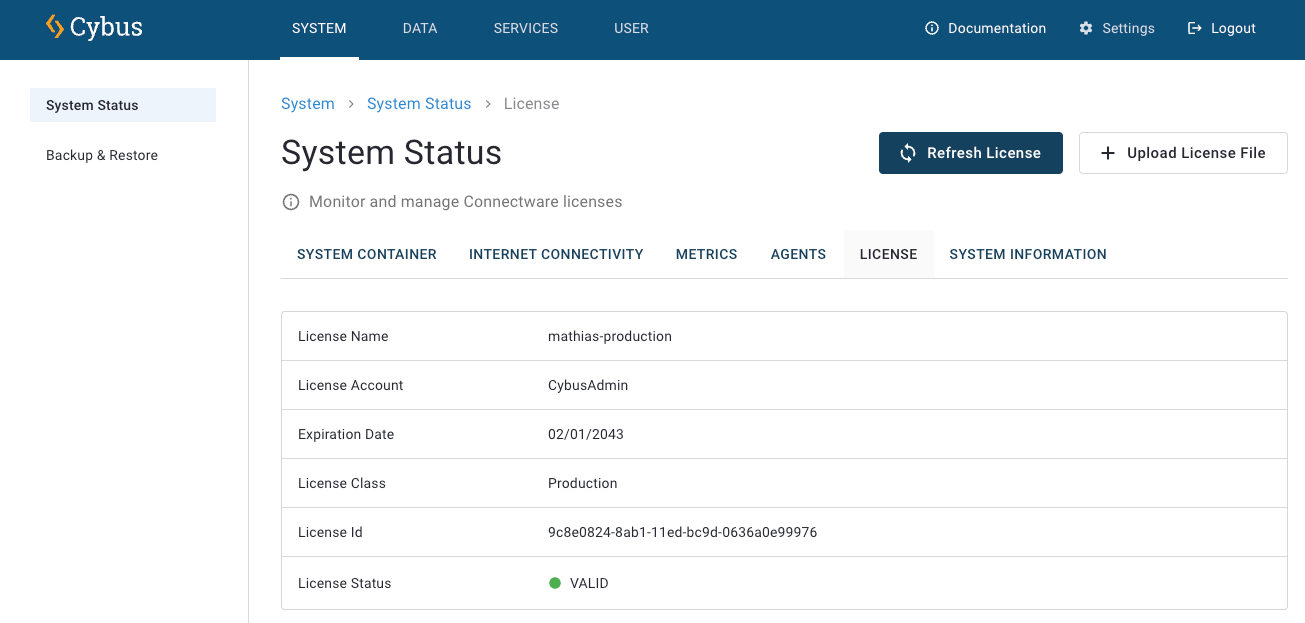
License Information
To see the license information, click
Systemon the navigation panel and clickLicense.
System Information
To see the Connectware version and the installed services, click
Systemon the navigation panel and clickSystem Information.

Internet Connectivity
Find the connectivity status to the Internet server addresses that are needed for service installation under the title Internet Connectivity. As Connectware is designed to run with or without Internet connectivity, this section only informs about the current connectivity status.
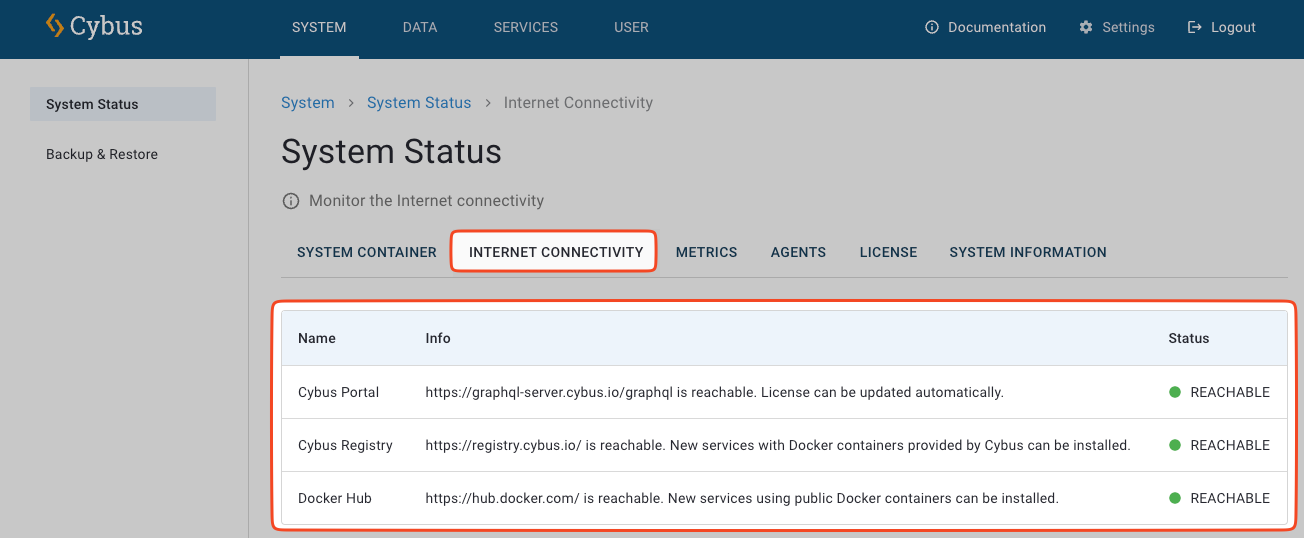
Connectivity to these addresses is needed when installing services that use additional containers. Other services that do not use Docker containers are not concerned at all and can always be installed and enabled, though. To explain this in detail:
Cybus Portal: If the DNS name of the Cybus Portal backend (graphql-server.cybus.io) is reachable, the license update can be performed online and automatically. If this address is not reachable, license updates must be performed manually by uploading a new license file. This is needed if there have been any changes in the license.
Cybus Registry: If this address is reachable, new services with Docker containers provided by Cybus can be installed and enabled. If the address is not reachable, services using Docker containers provided by Cybus can only be enabled if the Docker images have been pulled to the local system beforehand, such as during a previous enabling with available connectivity. Installed services that have been enabled at least once can always be continued to be used.
Docker Hub: If this address is reachable, third-party services using public Docker images from Dockerhub can be installed and enabled. Connectivity to Dockerhub is not required for running Connectware, and it is also not needed for installing any service provided by Cybus.
Connectware Version Information: If this connectivity is available, information about the latest available Connectware version will be displayed here. If a newer version is available, direct links to download the installer and the release notes will be shown here (see example below), otherwise the text will just confirm that the local version is the newest version. If this connectivity is not available, no online check for updates is performed.

Metrics
On the navigation panel, click
System.
Click
Metrics.
The
Metricstabs shows a number of values collected throughout operational times.
Overview
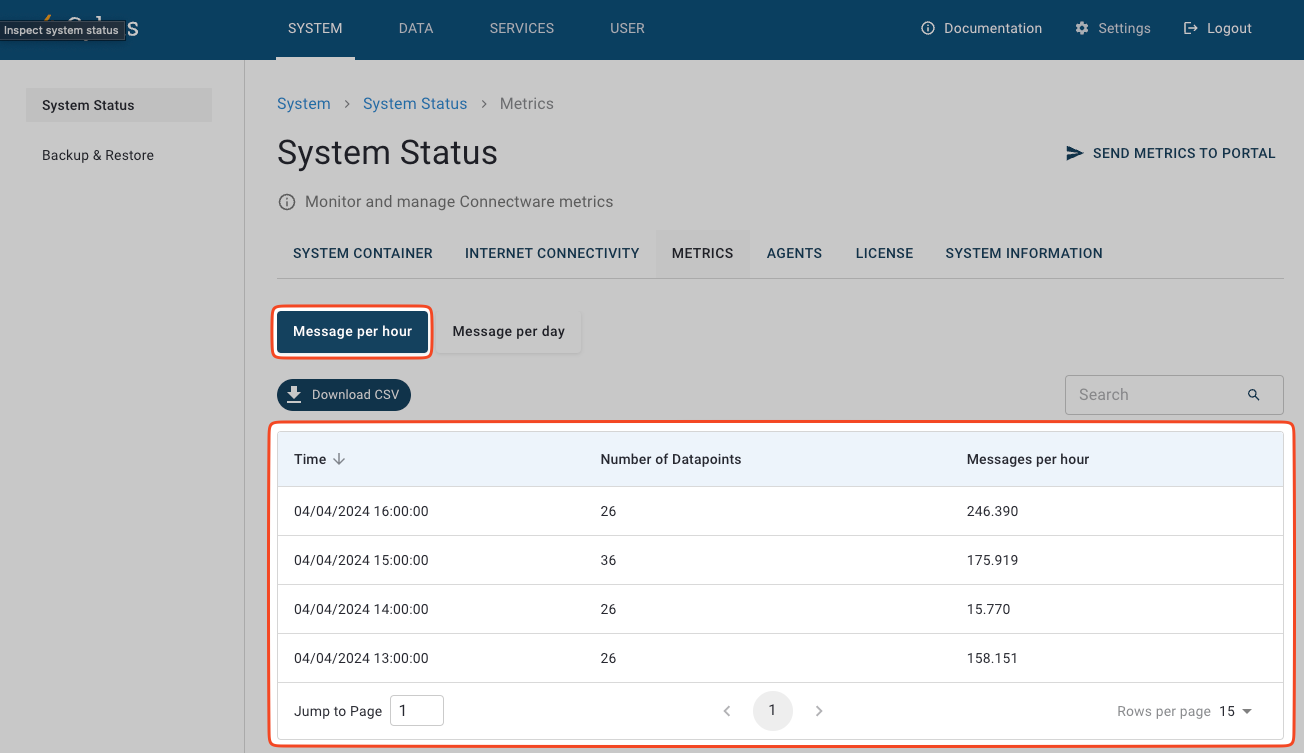
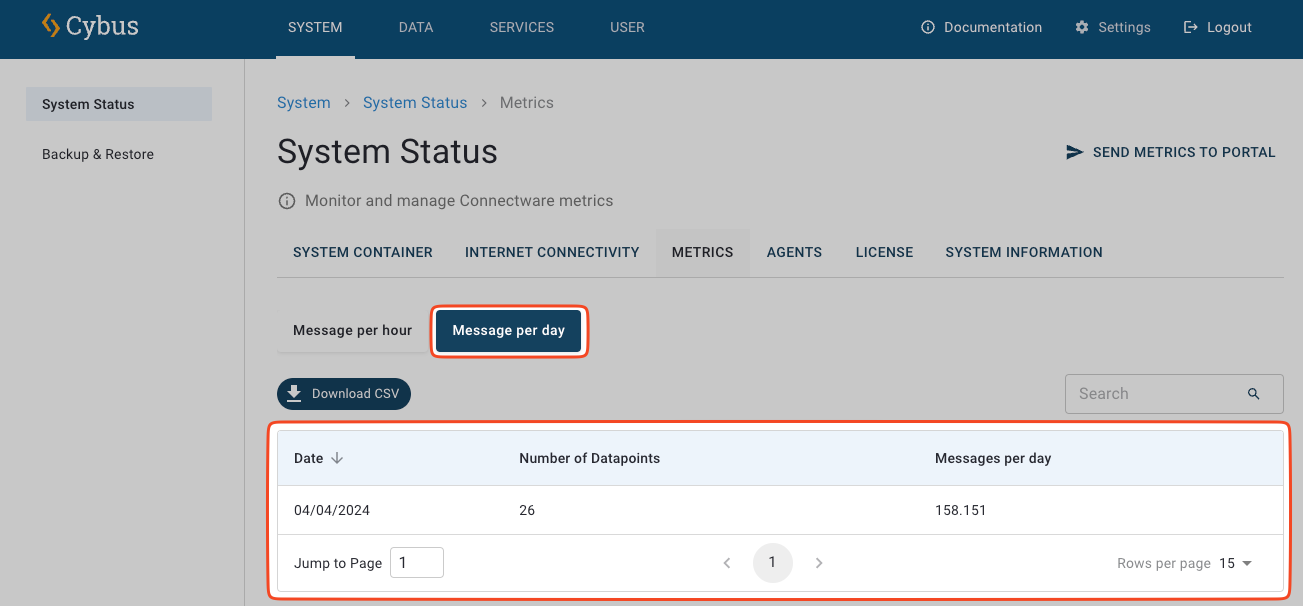
The metrics view provides two tables that present data.
Hourly Collected Metrics
This table consists of the following columns:
Date/Time - Date and Time of the snapshot
Number of Datapoints - Number of connected Endpoints at the time instant of the snapshot
Messages per hour - Number of messages transferred by the broker during the hour between the previous snapshot to the current one
Daily Collected Metrics
This table consists of the following columns:
Date - Date of commulated metrics
Number of Datapoints - Number of connected Endpoints at the time instant of the daily snapshot
Messages per day - Number of messages transferred by the broker during the day
The collected metrics are computed in two ways.
The Number of Datapoints are a snapshot at the end of the day
The Messages per day is the sum of all messages per hour for this specific date
Status
On the navigation panel, click
System.
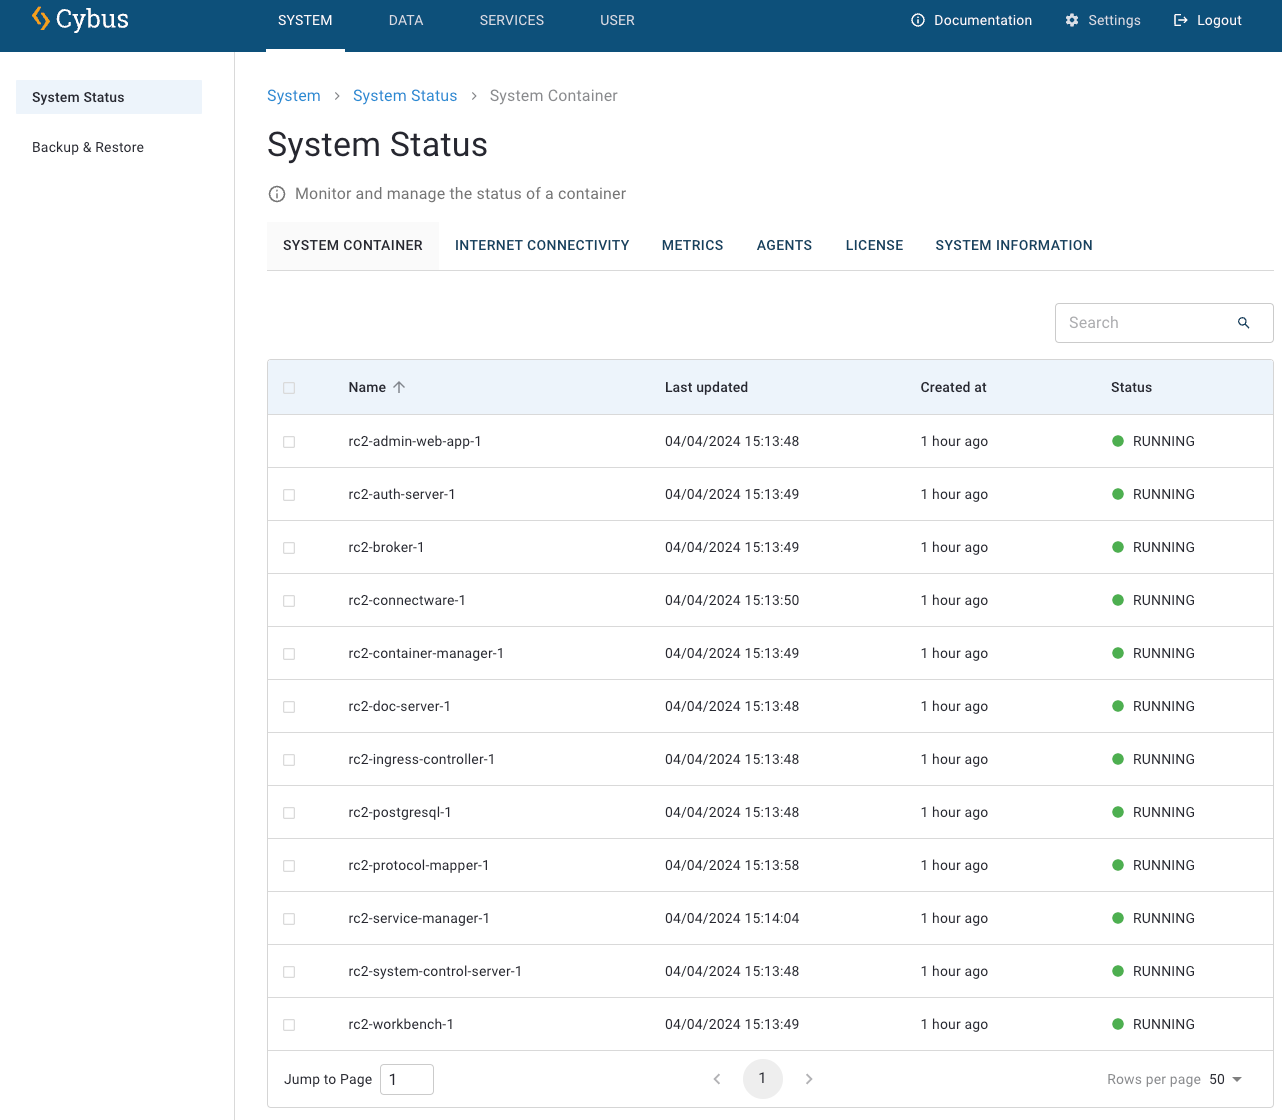
2. This opens the status view which contains information about all running Connectware containers.
Overview
The status view contains the following information
Name
The name of the container.
State
Connectware containers can enter one of the following states:
running -> The container is working as expected.
starting -> The container is currently in the process of starting.
stopping -> The container is currently stopping.
restarting -> The container has triggered the restarting procedure.
exited -> The container was shut down and won’t restart automatically.
created -> The container was created but not yet started.
Uptime
The time the container is already running.
Controls
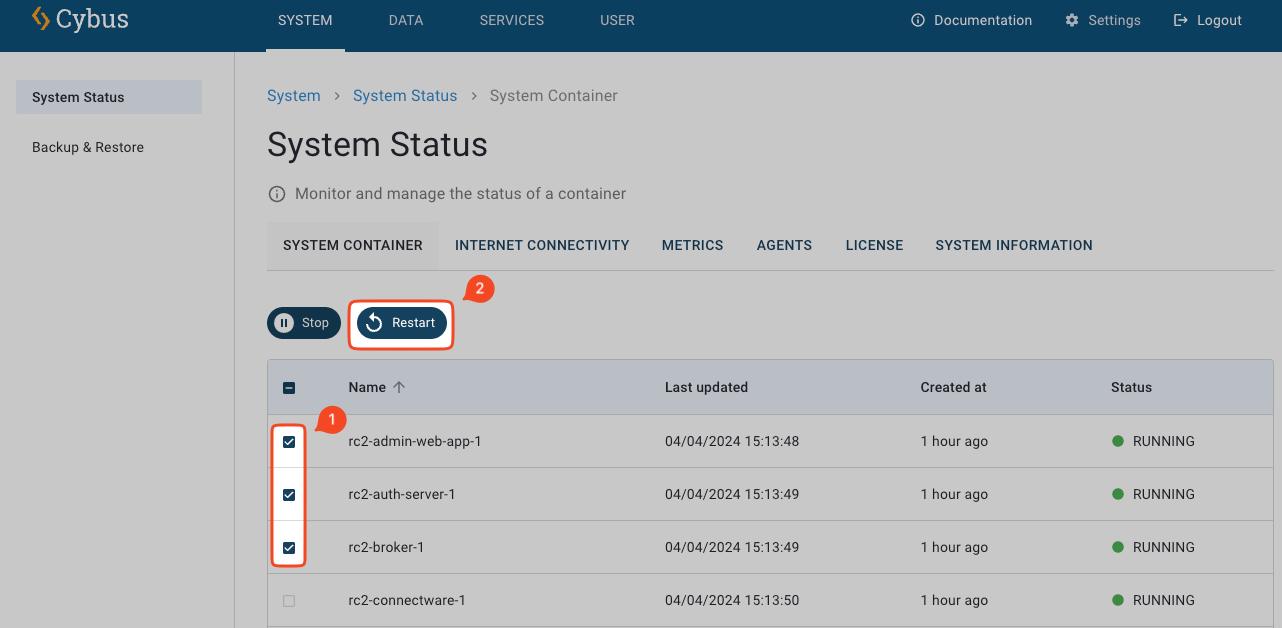
To restart Connectware containers, select one or more instances (1.) and click Restart (2.) on the toolbar.
Container Details View
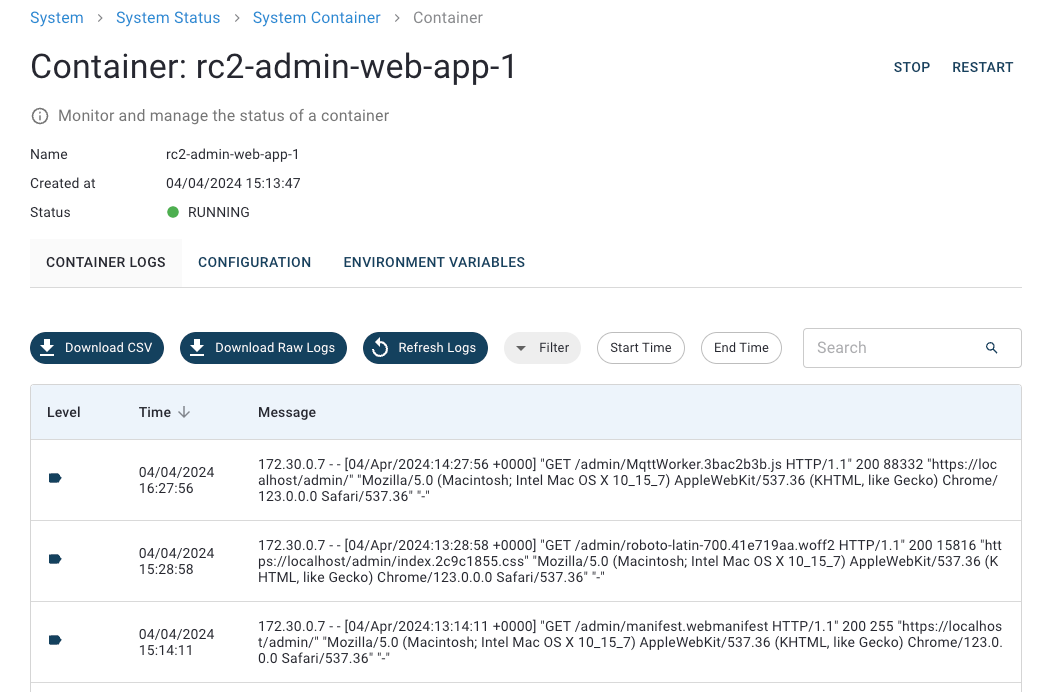
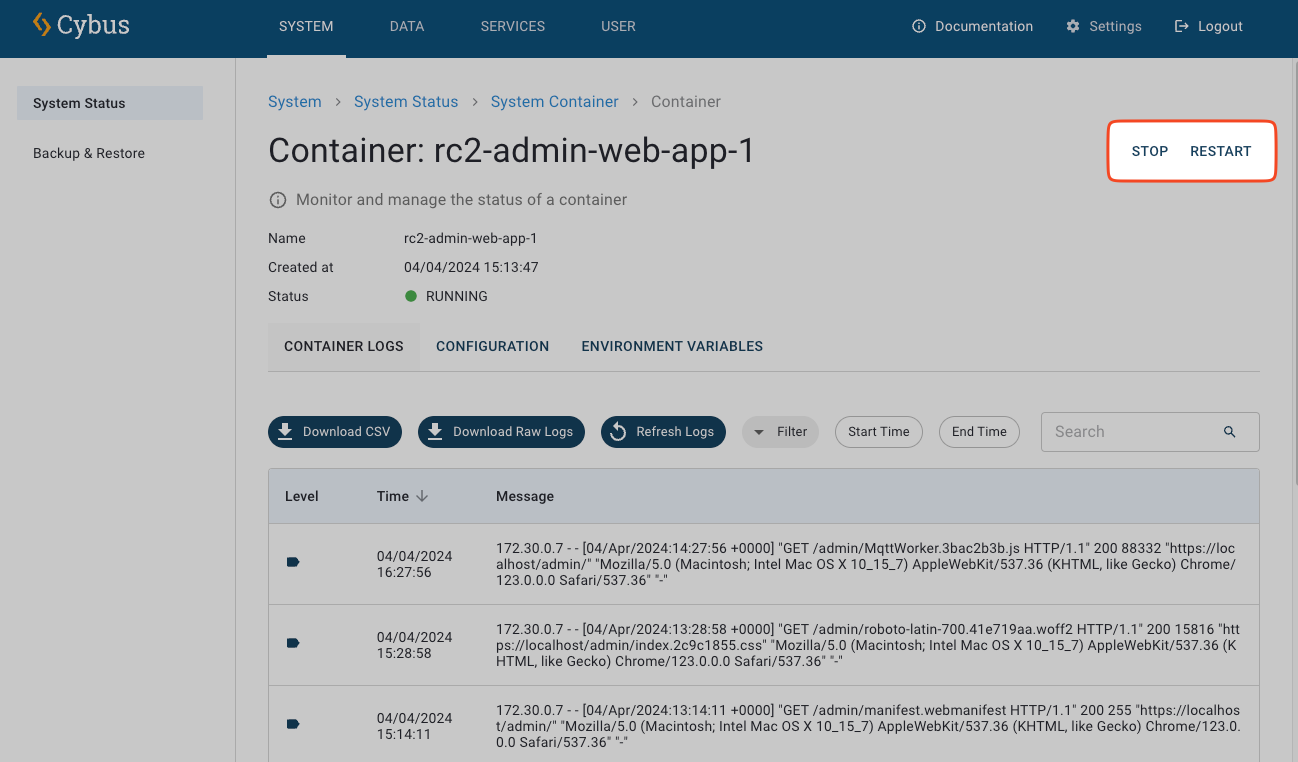
The Container Details view contains more information about a single container. To open this view, select one of the containers displayed in the status view.
A window similar to the picture below will open.
To unfold the individual resources just click on the appropriate tab.
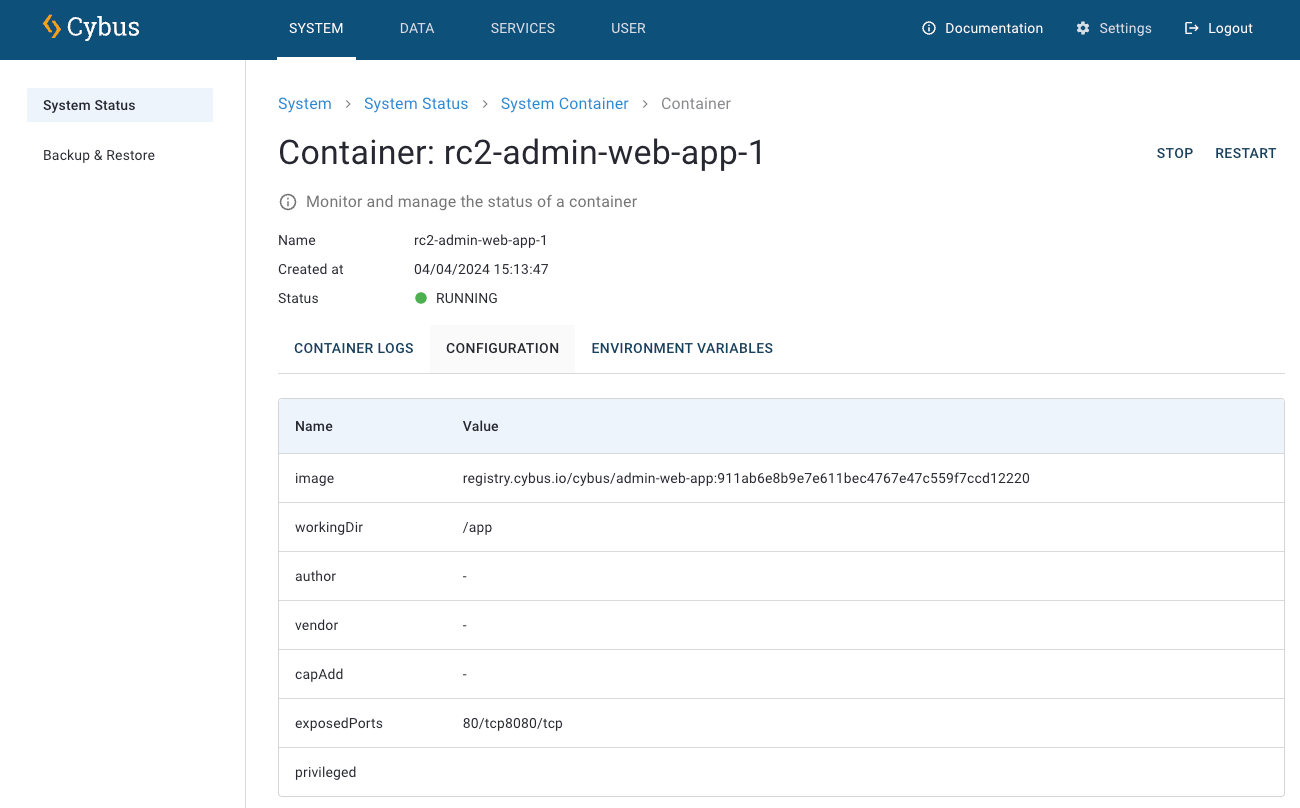
Configuration
The Configuration tab shows information about container settings including
capAdd -> Added capabilities.
exposedPorts -> Ports exposed by the container.
image -> The docker image used by the container.
privileged -> Shows if the container is running in privileged mode.
workingDir -> The working directory inside the container.
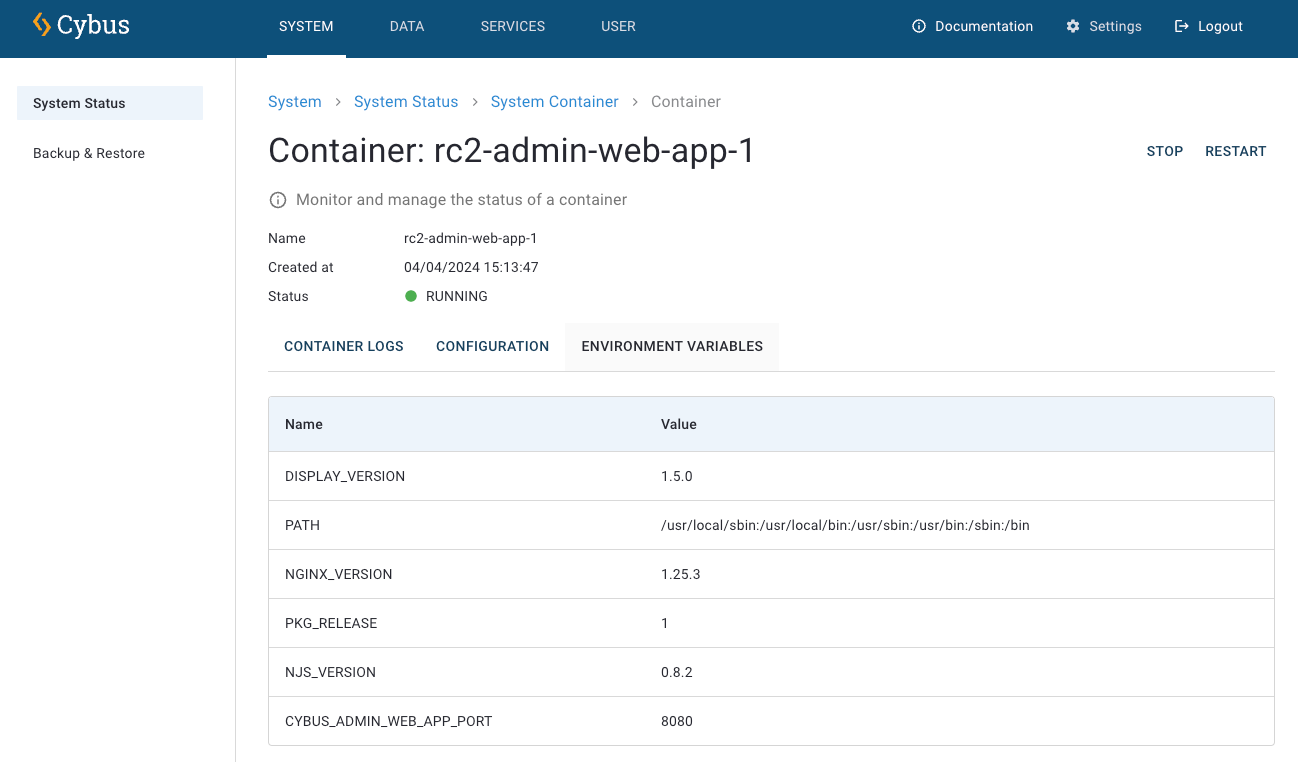
Environmental Variables
The Environmental Variables tab shows all environmental variables available to the processes inside the
container at runtime.
Container Logs
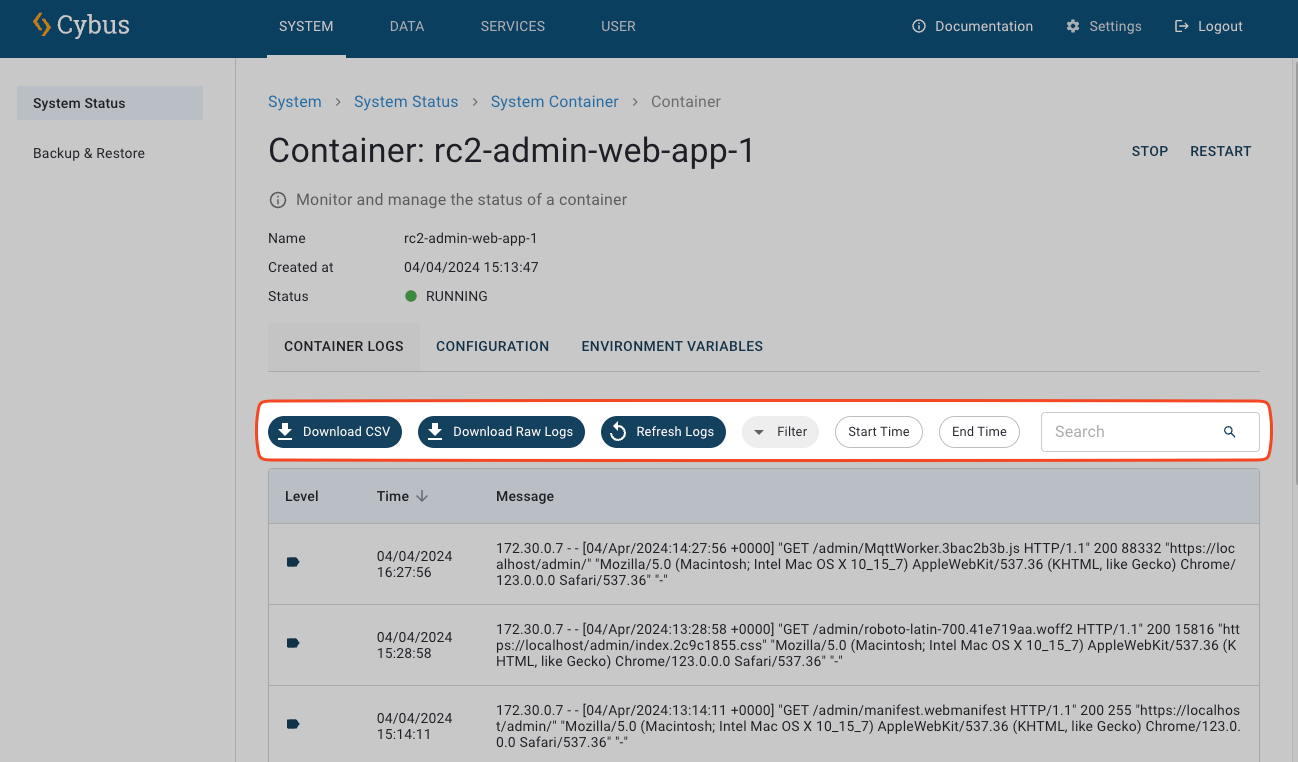
The Container Logs tab shows the logging message of the selected container. In the
toolbar at the top right of this section, there are the following buttons:
Search for log entries containing the entered keyword. This also filters the current table.
Download CSV to download the displayed rows of the log file as a CSV (Comma-Separated-Value) text file (Note: Log lines outside of the window are not downloaded, and the complete download is limited to the most recent 500 lines; use Download raw log for a complete log download)
View columns to select the columns to be shown
Filter table to select filter criteria to have only a subset of rows shown
Download raw logs to download the full log file in order to pass on this file to Cybus Support for in-depth issue resolution. See below for an explanation of the file format.
and Refresh to refresh (reload) the currently shown log messages.
The “Download raw logs” button returns the stream output of “docker logs” directly, whereby each log line is prepended by some control characters. The exact stream format is described in the Docker API documentation of the “Attach” endpoint, see e.g. https://docs.docker.com/engine/api/v1.41/#operation/ContainerAttach . Basically, each line is prepended by an eight byte header and another two byte marker. For text file processing, the first 10 bytes of each line should hence be ignored. A suitable Linux command line tool for that would be cut -b11- < inputfile.log where the output lines are printed from the 11th byte onwards each.
Controls
The details view offers capabilities to
Stop -> Stop the selected container.
Restart -> Restart the selected container.
Delete -> Delete the selected container (the container has to be stopped first).
Expand all Resources -> Unfold all of the tabs described above.
In addition to these global controls, each details tab provides individual controls to filter, organize, or search the data provided.
- Search

Search for entries containing the entered keywords. This also filters the current table.
- Show Columns

Select the columns to be shown.
- Filter

(Not in Logs section.) Select from available options to filter the rows to be shown.
- Refresh

Only available in the
Container Logssection. This option reloads the displayed logs.
Retrieving More System Information
The Connectware REST interface provides a unique /api/system/info endpoint that can be used to retrieve more in depth system information.
Overview
The information provided by the endpoint are as follows:
License
In depth information about the license file used to active the currently running Connectware instance. This includes:
File A schematic display of the license features and expiration.
Name The license name. This name corresponds to an existing customer license in the Cybus Portal.
Valid The current license state. As long as a valid license is provided the value will be true.
Time
Timestamp of the query.
Version
The version of the currently running Connectware instance.
How to Access the Endpoint
Requirements
To access the REST endpoint a user has to authenticate with Connectware first. HTTP read permissions for the /api/system/info path have to be added to the user account before attempting to connect with the endpoint. To learn more about user permissions, please read the User Section of the documentation.
Example
A short example query using curl.
curl -u <USERNAME>:<PASSWORD> https://<HOSTNAME>:443/api/system/info --insecure
System Health
The Connectware REST interface provides a unique /api/system/health endpoint that can be used to retrieve health data information about system containers.
Overview
The information provided by the endpoint are as follows:
System
Overall object key
Status Array of system container
Name Name of the system container
Status Current status of the system container
Resources
Not implemented yet
Requirements
To access the REST endpoint a user has to authenticate with Connectware first. HTTP read permissions for the /api/system/info path have to be added to the user account before attempting to connect with the endpoint. To learn more about user permissions, please read the User Section of the documentation.
curl -u <USERNAME>:<PASSWORD> https://<HOSTNAME>:443/api/system/health --insecure


